Jean Claude
Junior Member
- Joined
- Jan 2, 2009
- Messages
- 2,613
- Location
- Centre FRANCE
- Aircraft
- I piloted gliders C800, Bijave, C 310, airplanes Piper J3 , PA 28, Jodel D117, DR 220, Cessna 150, C
- Total Flight Time
- About 500 h (FW + ultra light)
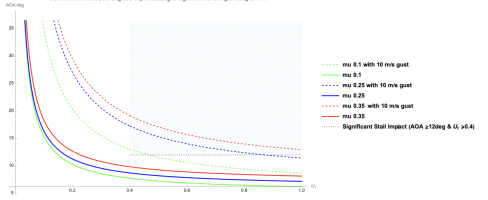
A vertical gust of 2.5 m/s, for example, while cruising at 25 m/s, suddenly increases the angle of attack of the rotor disk by Atan (2.5/25) or 0.1 rad.
According my spreadsheet, this momentarily creates an overload of 0.23 g (at constant Rrpm).
Whereas a fixed wing cruising at CL = 0.5, for example, and an aspect ratio of 7, would give a dCL/di slope of 4.5 / rad (*), giving ΔCL = 0.1*4.5 = 0.45, ie an overload of ΔCL / CL = 0.90 g.
The gyrocopter is therefore much less sensitive to gusts than a fixed-wing aircraft.
(*) dCL/di = 5.7/rad + CL/πA If A = Aspect ratio
Last edited: