You are using an out of date browser. It may not display this or other websites correctly.
You should upgrade or use an alternative browser.
You should upgrade or use an alternative browser.
New Magni Enclosed Gyro........
- Thread starter Greg Mitchell
- Start date
Fl90
Gold Member
Pual, I was finnishing the answer from the other poster. The numbers were transposed, as the other post stated. As for the validity of the numbers given in the first place, I have no idea. Perhaps Cuck or Doug could answer your question here.
Cheers, Phil.
Cheers, Phil.
Aussie_Paul
A reforming stirrer!!!!!
- Joined
- Oct 30, 2003
- Messages
- 4,441
- Location
- Ballarat Australia
- Aircraft
- None at the moment.
- Total Flight Time
- Since 1982 Gyro 5000+ mostly instructing, and approx. 200 fixed wing in the late 1960s.
Pual, I was finnishing the answer from the other poster. The numbers were transposed, as the other post stated. As for the validity of the numbers given in the first place, I have no idea. Perhaps Cuck or Doug could answer your question here.
Cheers, Phil.
I appreciated the help Phil. As I always seem to be struggling for time I grabbed the figures to use instead of working them out from Dougs formulae.

Aussie Paul.
gyrogreg
Senior Member
- Joined
- Dec 9, 2003
- Messages
- 1,000
- Location
- Ste. Genevieve, Missouri, USA
- Aircraft
- Magni M-16 Gyroplane
- Total Flight Time
- 3000 total, 2000 Gyro
Thanks Chuck. Back to thinking!! No that seems like a wasted energy with me.
Paul and Chuck - I'm probably all wet on this, and I'm sure some of you will hop all over this. But, please hear me out - I am still not convinced that the stronger AOA stability doesn't happen when the HS is downloaded.
There are two mechanisms for aircraft with both front and rear wings to respond to a change in airspeed (or AOA?) - consider a sudden increased airspeed due to a nose-on wind gust:
The first mechanism happens when both "wings" are at a positive AOA - both up-lifting - this is the mechanism Raghu has emphasized before in his arguments that it does not matter whether the HS is up or down lifting! When the airflow over the up-lifting wings increases, both "wings" increase their up-lift in the same proportion at the same time and the aircraft starts to rise. This rising, upward movement, creates a reducing AOA on the up-lifting wings - eventually reducing the AOA enough on both wings that the rising steadies out into the original trimmed airspeed. In this mechanism,the aircraft is rising more or less level because both wings are changing their up-lift at about the same rate at the same time.
The second mechanism happens when the front "wing" is up-lifting, but the rear "wing" is down-lifting: With a sudden increase in airspeed from a nose-on gust of wind, the front wing begins to rise with the increased up-lift - as in the example above. So the aircraft starts to rise as in the example above. However, the rear "wing", with the negative AOA responds to the increased airflow over it by increasing its down-lift. Now, with the front "wing" lifting up, and the rear wing lifting more down, an immediate nose-up pitch happens from the increased differential in lift between the two "wings".
What I am suggesting is possibly what Paul is describing as a "stronger" reaction when the HS AOA is negative rather than positive! With the HS in a positive AOA arrangement, AOA stability results with less actual nose pitch up (or down in the reverse). With the HS in a negative AOA arrangement, the increased differential lift between the two "wings" creates an immediate nose pitch reaction - raising the nose quicker to the point where the climbing airspeed and AOA on both "wings" is back at the original trimmed condition quickly - and the pilot gets the pitcha ttitude cue that it is climbing.
I can agree that AOA stability is (or can be) achieved with the HS lifting either up or down. I do understand that the difference in lift curves between a rotor and the HS "wing" are different and can contribute some to the AOA stability. And, for certain, the cyclic or "blowback" moving the RTV back and forth really confuses what happens during such transients. But, I do not see how an up-lifting HS can provide as strong static stability or the strong pitch response to changes in AOA or airspeed - as a down-lifting HS does!
My perceptions of this were probably formed when I was a kid building a line control P51 model. The plans said to balance forward of the 1/4 chord of the wing. I thought this is silly - why do you want the tail to push down, that's not efficient - that just makes the main wing have to lift harder! So I balanced it out with the CG right on the 1/4 chord - in fact I did this twice and wrecked it each time! Before the first circle was halfway through, I over-controlled, went right over my head and straight into the ground on the other side - twice! So, on the third P51 rebuild, I tried balancing it like the plans said! Had fun with that model the rest of the summer! Since then, I always bought into the reasoning that the forward CG was requiring the HS to push down so it would be stable and easier (or possible) to fly it!
If my reasoning is not correct, I sure would like someone to take more than one line to explain to me - and to Paul - why it is not correct! I'm just not comfortable with throwing away the common appreciation that the CG should be forward of the main "wings" thrust vector in order to be properly, or at least more strongly, statically (AOA or Airspeed!?) stable! If the CG is in-between the two "wings", the rear "wing" must also be up-lifting to balance it! That up-lifting Hs is what I cannot reason is as good as a down-lifting one!
- Thanks, Greg
Aussie_Paul
A reforming stirrer!!!!!
- Joined
- Oct 30, 2003
- Messages
- 4,441
- Location
- Ballarat Australia
- Aircraft
- None at the moment.
- Total Flight Time
- Since 1982 Gyro 5000+ mostly instructing, and approx. 200 fixed wing in the late 1960s.
That’s called mind over matter, Paul.
The same reason my car drives better right after it’s been washed.
Geez, your car does that too Chuck?:lol: My red car is faster though.:lol:
Aussie Paul.
JEFF TIPTON
Senior Member
In the fixed wing aircraft the balance point will generally be in the 25% to 35% aerodynamic chord of the wing. This point is in front of the Center of Pressure that is generally around the 50% aerodynamic chord. As the center of pressure is always pushing up and gravity is pulling down in the CG, the nose of the aircraft will go down. The horizontal stabilizer applies a down force to counteract the Center of Pressure. As airspeed increases, the wing produces more lift, which causes the nose to rise. A decrease in speed reduces the lift of the wing and nose drops. The stability is a function of cubic feet not necessarily square feet, which many reference. A twenty square foot stabilizer at ten feet from the Center of Pressure would be just as effective as Ten square foot stabilizer at twenty feet from Center of Pressure. A canard configuration is interesting. It works because the front wing has more weight per square foot that the rear wing, IE a higher wing loading. As the airspeed reduces the front wing cannot support as much weight hence the nose drops, the airspeed increases the nose rises and it will oscillated a few times up and down before all is in balance.
In the end the configuration and design elements used by the engineer is a trade off. What they might want to use might not be possible due to weight, aerodynamics, cost, etc. Certified aircraft must meet a standard whether it is Cessna, Piper or even the new LSA's. Stability is just one of many considerations. The important thing, when it is all over, It works.lane:
In the end the configuration and design elements used by the engineer is a trade off. What they might want to use might not be possible due to weight, aerodynamics, cost, etc. Certified aircraft must meet a standard whether it is Cessna, Piper or even the new LSA's. Stability is just one of many considerations. The important thing, when it is all over, It works.
lane:gyrogreg
Senior Member
- Joined
- Dec 9, 2003
- Messages
- 1,000
- Location
- Ste. Genevieve, Missouri, USA
- Aircraft
- Magni M-16 Gyroplane
- Total Flight Time
- 3000 total, 2000 Gyro
Both wings are uplifting on a VariEze, Greg. It is claimed to have excellent angle of attack stability.
Hi Chuck. I also understand that the VariEze type canards rely on the wash from the canard on the main wing to achieve both this AOA and stall characteristics. I'm not totally familiar with this, I remember reading and listening to Burt Rutan back when he designed the first versions, explaining how they paid careful attention to this and relied on the canard interference with the main wing to achieve these flight characteristics. As Jeff mentions, the canard is more heavily loaded and flies at a higher AOA to stall before the main wing so the nose drops before the main wing stalls. I believe the downwash from the canard over the main wing is part of the AOA stability he achieved. I'm not sure we can count on these type of mechanisms in a gyro.
- Thanks, Greg
JEFF TIPTON
Senior Member
It would be an interesting machine. One side note the earlyVarieze had a problem when going close to a thunderstorm. The nos would rise and put the aircraft in climb and some conditions there was not enough control to overcome this. Later models used a diffrent airfoil to correct this.
Chuck_Ellsworth
Platinum Member
The only close up time I ever had with a VariEze was a few years ago in Narsarsuaq Greenland on one of our ferry flights.
Some guy landed with a mechanical problem and we spent a couple days helping him get it resolved.
We departed Narsarsuaq about a half hour ahead of him and a few hours later we heard him frantically trying to contact Gander Oceaniac Control....
...we were able to relay for him and advise Gander that he was having engine problems about half way between Greenland and Canada......
...it was very stressful thinking about what he was going through and only be able to help by relaying the messages.
Fortunately it kept running until he reached a Canadian airport.
They are a neat airplane, but I wouldn't want to fly one across the North Atlantic route.
Udi
Platinum Member
We ARE counting on this kind of mechanism in a gyro, Greg. The rotor is significantly more heavily loaded than the typical stab. That is part - not all - of the AOA stability mechanism....I'm not sure we can count on these type of mechanisms in a gyro.
- Thanks, Greg
Udi
gyrogreg
Senior Member
- Joined
- Dec 9, 2003
- Messages
- 1,000
- Location
- Ste. Genevieve, Missouri, USA
- Aircraft
- Magni M-16 Gyroplane
- Total Flight Time
- 3000 total, 2000 Gyro
We ARE counting on this kind of mechanism in a gyro, Greg. The rotor is significantly more heavily loaded than the typical stab. That is part - not all - of the AOA stability mechanism.
Udi
Udi, agreed! I was really refering to the front "wing" wash depended on to affect the lift and AOA of the rear "wing". It might be hard to imagine that deflected air form the rotor has much affect on the air the HS is flying in..
Other things can affect this "wash" on the HS though too! - air deflection around a cabin and into the prop, etc. On some gyros, including both the Magni M23 and the new Xenon, I am suspecting that some of the aerodynamics, perhaps the center of pressure of the enclosure and the airflow aft of the engine cowling, airflow at the HS, etc, may actually be integral parts of the final stability performance. It is interesting to note that, at least the aft portion of the enclosure (around the engine) is similar on both the Magni M23 and the Xenon. Not that either designer might be able to tell us specifically how that works, or that that works, I suspect both designers arrived at their final configurations via flight test iterations. But, it would be very interesting to see some wind tunnel testing comparisons on a lot of gyro enclosures.
- Greg
Al_Hammer
Platinum Member
- Joined
- Oct 30, 2003
- Messages
- 1,347
- Location
- Deep River, CT
- Aircraft
- none currently
- Total Flight Time
- 80 gyro; 65 helicopter(R22)
Summing it all up
Summing it all up
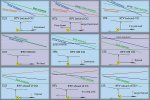
I made up a diagram showing the 9 basic combinations of CLT, HTL and LTL with RTV ahead of, behind, or On the CG.
To understand the graphs, all you need to know is that the Blue line is total pitching moment and it must have a negative slope for static stability. Angle of attack goes up, moment gets "less positive", or" more negative."
The steepness of the slope of the pitching moment also tells us something. It indicates the PITCH STIFFNESS.
It tells us how aggressively the gyro will try to oppose a pitch disturbance from equilibrium.
You can compare the different configs and see that some have strongly sloping blue lines and some have more anemic slopes. All configs can be made stable if the stab is made large enough to completely counteract other moments.
A downloaded stab loads the rotor and is less efficient than a non loaded stab.
The thing to notice is that there is no inherent advantage to a moderate HTL with a downloaded stab vs a CLT machine with no load, or a LTL with moderate upload, etc. If the pitch moment lines have equal slopes than the configs have equal stability.
I made no attempt to get the curves precisely drawn and I didn't label the AoA and pitch moment axes, etc. Also, I may have mistakes in the graphs, so hopefully someone will check my work and let me know.
(EDIT: updated graph with some minor fixes.)
Summing it all up
I made up a diagram showing the 9 basic combinations of CLT, HTL and LTL with RTV ahead of, behind, or On the CG.
To understand the graphs, all you need to know is that the Blue line is total pitching moment and it must have a negative slope for static stability. Angle of attack goes up, moment gets "less positive", or" more negative."
The steepness of the slope of the pitching moment also tells us something. It indicates the PITCH STIFFNESS.
It tells us how aggressively the gyro will try to oppose a pitch disturbance from equilibrium.
You can compare the different configs and see that some have strongly sloping blue lines and some have more anemic slopes. All configs can be made stable if the stab is made large enough to completely counteract other moments.
A downloaded stab loads the rotor and is less efficient than a non loaded stab.
The thing to notice is that there is no inherent advantage to a moderate HTL with a downloaded stab vs a CLT machine with no load, or a LTL with moderate upload, etc. If the pitch moment lines have equal slopes than the configs have equal stability.
I made no attempt to get the curves precisely drawn and I didn't label the AoA and pitch moment axes, etc. Also, I may have mistakes in the graphs, so hopefully someone will check my work and let me know.
(EDIT: updated graph with some minor fixes.)
Attachments
Last edited:
gyrogreg
Senior Member
- Joined
- Dec 9, 2003
- Messages
- 1,000
- Location
- Ste. Genevieve, Missouri, USA
- Aircraft
- Magni M-16 Gyroplane
- Total Flight Time
- 3000 total, 2000 Gyro
Great job Al!
Great job Al!
Do you mind if I raise some thoughts though? These might be a bit of more basic. I might be blind, but these diagrams do seem to support my suggestion that a down-loaded HS is at least better. Please tell me where I am wrong!:
1) In the CLT column: This seems to show a steeper (stronger) total pitching moment for the downloaded stab. Is this correct? If this is truly CLT, we would not want or need a lot of HS load in either direction reacting to propwash because that would make the gyro pitch sensitive to power setting - flying nose higher or nose lower with a non-neutral HS. With CLT, at least for "balancing" the non-existant prop thrust moment, any HS moment flies the nose higher or lower - depending on both propwash on the HS and ambient airspeed on the HS. But also, if the gyro has any airframe drag/lift moments (usually in the nose-down direction) you would need some down-loaded HS to balance that. My conculsion from all above, and from the stronger pitch moment curve in your top diagram in the first column is that a down-loaded HS will both have stronger pitch response and balance the airframe drag/lift moments so it would not lower the nose at higher airspeeds (to be more unstable at those higher airspeeds). But, with CLT, there are no prop thrust moments to balance, so with any HS AOI to the keel, the nose pitch is going to change with power changes because of propwash on the HS!
2) In the HTL column: Again, the higher HS download has the stronger total pitch moment. But, for any HTL, the gyro is going to fly nose-down a bit, and that airframe attitude will automatically provide a download on the HS mounted at least level on the keel. But, you don't want the gyro flying nose-low, so the HS down-lift does need to be the stronger version as in the top middle diagram. This down lift should not be left to result from nose-down flight of the gyro - it is much better to create the download from either its mounted AOI or taking advantage of any propwash created AOA on the HS. But, essentially, if the gyro has a HTL, the HS needs to be powerful enough and arranged such to effectively "balance" the prop thrust offset. My conculsion from this, for several reasons in this paragraph, is that the bottom two examples of HTL are not adequate design of the HS - unless it's not really HTL!
Just a note, you are correct, any downloaded HS is less efficient - it creates more load on the rotor. But, good design of the HS can achieve significant necessary nose-up moments without presenting a lot of actual download on the HS - that the rotor has to add to it's lift! A clean airfoil, placed far aft for a long moment arm, and other techniques can be employed to minimize the "down" side of a down-loaded HS (pun intended!)
3) In the LTL column: Again, this seems to show the less up-loaded HS provides the stronger total pitch moment. Unless I'm really missing something, this seems to support my argument that the downloaded HS is more pitch stable! Where am I going wrong? As in the HTL example, a stronger HS lift is required to "balance" a stronger prop thrust offset. The situations where little HS moment is required is the situation where there is little prop thrust offset, closer to CLT anyway - neglecting any airframe drag/lift moments. And, as in the HTL case, the airframe flight attitude - nose-up in the LTL example, will automatically create the up-lift on a keel level HS due to the flight attitude created by the LTL! And, a LTL cannot really handle a down-loaded HS because that causes the nose to raise even higher than it does with the LTL! (Same reason you don't want an up-lifting stab on a HTL!)
But, we should not neglect the effects of airframe drag/lift either - it gets much stronger at higher airspeeds where we really need the HS to "balance" those moments so the gyro doesn't pitch to a less stable attitude at higher airspeeds - probably a contributing root cause to stability accidents at higher airspeeds anyway! So, since most gyro airframe drag/lift moments are nose-down, the same HS that is holding the LTL nose down, is not helping to hold the nose up with increasing airframe drag/lift moments at higher airspeeds.
Therefore, taking all of the above into account, and your drawings that seem to verify that a stronger down-lifting HS does provide stronger stabilizing pitch moments, where am I going wrong when I suggest that the down-loaded HS is more stable? If you want to establish this stronger down-loaded HS, it requires a HTL to do so. And that same down-loaded HS will also be able to "balance" the nose-down airframe drag/lift moments AT THE SAME TIME!
Looking at the lower right, LTL with large up-loaded HS, how would that balance any additional nose-down moments from the enclosure, landing gear, etc. I still submit, an up-lifting HS, as required with a LTL (if you want to reasonably balance the prop thrustline so the aircraft won't pitch so bad with power changes), is not able to "balance" the airframe moments - it just isn't lifitng in the right direction to do so!
If the up lifting HS, with increasing airspeed, is adding to the increasing nose-down pitch moment from the airframe drag/lift moment, it seems to me that increasing airspeed lowers the nose more and increases the airspeed, which further lowers the nose, etc., etc., etc. Is this Airspeed stability, or is speed just going to get faster and faster - airspeed unstable?
Have at me - where am I wrong.
Thanks again for the diagrams. Now you wouldn't want to expand your matrix of diagrams to add in the effects of airframe drag/lift moments, would you? I don't think the real story is over until ALL the moments on the aircraft are considered!
- Greg
Great job Al!
Al, Very interesting. You did a lot of work here. Summing the moments to get the total moment is very instructive in these diagrams! I hope people will try to digest what these diagrams are telling us.I made up a diagram showing the 9 basic combinations of CLT, HTL and LTL with RTV ahead of, behind, or On the CG.
-------
Do you mind if I raise some thoughts though? These might be a bit of more basic. I might be blind, but these diagrams do seem to support my suggestion that a down-loaded HS is at least better. Please tell me where I am wrong!:
1) In the CLT column: This seems to show a steeper (stronger) total pitching moment for the downloaded stab. Is this correct? If this is truly CLT, we would not want or need a lot of HS load in either direction reacting to propwash because that would make the gyro pitch sensitive to power setting - flying nose higher or nose lower with a non-neutral HS. With CLT, at least for "balancing" the non-existant prop thrust moment, any HS moment flies the nose higher or lower - depending on both propwash on the HS and ambient airspeed on the HS. But also, if the gyro has any airframe drag/lift moments (usually in the nose-down direction) you would need some down-loaded HS to balance that. My conculsion from all above, and from the stronger pitch moment curve in your top diagram in the first column is that a down-loaded HS will both have stronger pitch response and balance the airframe drag/lift moments so it would not lower the nose at higher airspeeds (to be more unstable at those higher airspeeds). But, with CLT, there are no prop thrust moments to balance, so with any HS AOI to the keel, the nose pitch is going to change with power changes because of propwash on the HS!
2) In the HTL column: Again, the higher HS download has the stronger total pitch moment. But, for any HTL, the gyro is going to fly nose-down a bit, and that airframe attitude will automatically provide a download on the HS mounted at least level on the keel. But, you don't want the gyro flying nose-low, so the HS down-lift does need to be the stronger version as in the top middle diagram. This down lift should not be left to result from nose-down flight of the gyro - it is much better to create the download from either its mounted AOI or taking advantage of any propwash created AOA on the HS. But, essentially, if the gyro has a HTL, the HS needs to be powerful enough and arranged such to effectively "balance" the prop thrust offset. My conculsion from this, for several reasons in this paragraph, is that the bottom two examples of HTL are not adequate design of the HS - unless it's not really HTL!
Just a note, you are correct, any downloaded HS is less efficient - it creates more load on the rotor. But, good design of the HS can achieve significant necessary nose-up moments without presenting a lot of actual download on the HS - that the rotor has to add to it's lift! A clean airfoil, placed far aft for a long moment arm, and other techniques can be employed to minimize the "down" side of a down-loaded HS (pun intended!)
3) In the LTL column: Again, this seems to show the less up-loaded HS provides the stronger total pitch moment. Unless I'm really missing something, this seems to support my argument that the downloaded HS is more pitch stable! Where am I going wrong? As in the HTL example, a stronger HS lift is required to "balance" a stronger prop thrust offset. The situations where little HS moment is required is the situation where there is little prop thrust offset, closer to CLT anyway - neglecting any airframe drag/lift moments. And, as in the HTL case, the airframe flight attitude - nose-up in the LTL example, will automatically create the up-lift on a keel level HS due to the flight attitude created by the LTL! And, a LTL cannot really handle a down-loaded HS because that causes the nose to raise even higher than it does with the LTL! (Same reason you don't want an up-lifting stab on a HTL!)
But, we should not neglect the effects of airframe drag/lift either - it gets much stronger at higher airspeeds where we really need the HS to "balance" those moments so the gyro doesn't pitch to a less stable attitude at higher airspeeds - probably a contributing root cause to stability accidents at higher airspeeds anyway! So, since most gyro airframe drag/lift moments are nose-down, the same HS that is holding the LTL nose down, is not helping to hold the nose up with increasing airframe drag/lift moments at higher airspeeds.
Therefore, taking all of the above into account, and your drawings that seem to verify that a stronger down-lifting HS does provide stronger stabilizing pitch moments, where am I going wrong when I suggest that the down-loaded HS is more stable? If you want to establish this stronger down-loaded HS, it requires a HTL to do so. And that same down-loaded HS will also be able to "balance" the nose-down airframe drag/lift moments AT THE SAME TIME!
Looking at the lower right, LTL with large up-loaded HS, how would that balance any additional nose-down moments from the enclosure, landing gear, etc. I still submit, an up-lifting HS, as required with a LTL (if you want to reasonably balance the prop thrustline so the aircraft won't pitch so bad with power changes), is not able to "balance" the airframe moments - it just isn't lifitng in the right direction to do so!
If the up lifting HS, with increasing airspeed, is adding to the increasing nose-down pitch moment from the airframe drag/lift moment, it seems to me that increasing airspeed lowers the nose more and increases the airspeed, which further lowers the nose, etc., etc., etc. Is this Airspeed stability, or is speed just going to get faster and faster - airspeed unstable?
Have at me - where am I wrong.
Thanks again for the diagrams. Now you wouldn't want to expand your matrix of diagrams to add in the effects of airframe drag/lift moments, would you? I don't think the real story is over until ALL the moments on the aircraft are considered!
- Greg
Last edited:
Al_Hammer
Platinum Member
- Joined
- Oct 30, 2003
- Messages
- 1,347
- Location
- Deep River, CT
- Aircraft
- none currently
- Total Flight Time
- 80 gyro; 65 helicopter(R22)
Greg,
Thanks. I hope to have time later to elaborate on the diagrams and respond to your comments.
Thanks. I hope to have time later to elaborate on the diagrams and respond to your comments.
Udi
Platinum Member
Al, to check your work we need to know what assumptions you are making and some numbers to chew on... I am working on my own spreadsheet so hopefully soon we can compare results....Also, I may have mistakes in the graphs, so hopefully someone will check my work and let me know.
Greg, a stronger pitching moment doesn't mean better stability. The **slope** of the line that represents the sum of moments is an indication of static AOA stability.
Udi-
Last edited:
gyrogreg
Senior Member
- Joined
- Dec 9, 2003
- Messages
- 1,000
- Location
- Ste. Genevieve, Missouri, USA
- Aircraft
- Magni M-16 Gyroplane
- Total Flight Time
- 3000 total, 2000 Gyro
Al, another clear (to me) conclusion that I think can be drawn from your diagrams is that the more stable pitch moment - steeper negative slope - is when the CG is forward of the RTV.
You have always argued (with me at least), that the CG aft of the RTV can be stable - your diagrams support that - just not as stable! I have always argued that a gyro with the RTV forward of the CG is "G-Load" unstable - able to pitch nose down and agravate a reduced G transient - buntover progression!
Chuck has said several times recently, that the CG needs to be foward of the total thrust (rotor and HS), in order to be stable. It might be very helpful to see where the "Composite Thrust Vector" (CTV) is relative to the CG when a HS is installed. (Originally, Chuck's traditional argument that a gyro can buntover is for HTL gyros without a HS). But, for gyros with a HS, up or down lifting, where does the CG end up relative to the CTV? I think we will find, that considering all the moments on the airframe, the properly and adequately down-loaded HS can put the CG forward of the CTV.
(Maybe an uploaded HS (LTL) can also position the CTV aft of the CG. But, I would think that it is difficult to get an uploaded HS (LTL) to handle the other airframe drag/lift moments at the same time - for positive Airspeed stability!)
I am puzzled by this thing I have been calling G-Load stability - and that that relates to whether a gyro is capable of bunting over or not. This is the extention of Chuck's traditional scenario of the CG aft of the RTV being set up for a buntover if a reduced G-Load transient is encountered. I think you and others say this CG/RTV response to a G-Load transient is simply AOA stability. No matter what the name is, I think the essential issue is, when a gyro is confronted by a reduced G load transient, does the nose pitch in the down direction that agravates and can progress a nose-down progression buntover, or will this CG/CTV moment pitch the nose in the upward direction to counter the reduced G-Load transient and prevent a buntover?
To me, this is the essential static stability issue with gyros - is it capable of bunting over, and can this be identified by a flight test that increases the G-Load to see if the airframe response is in the stable direction. I believe it can, and I also believe that indicates whether the CG is fore or aft of the CTV - buntoverable or not! And, I believe that is what the "G-Load static stability flight test can determine!
I would just like to better understand if, why and how this is so. We do know that some HTL gyros without a HS require the stick to be pushed forward in a bank - to maintain airspeed - under the increased G-Load in the bank. This indicates the CG is aft of the RTV pulling the nose up! This also infers that a reduced loading on this gyro would push the nose down - progressive and in the buntover direction! According to Chuck's original CT/RTV argument, this is what can cause a bunvover!
As you are aware, we have been having very technical discussions elsewhere as to whether this G-Load flight test should be conducted fixed stick with airspeed as the indicator, or constant airspeed and floating stick, with stick pressure being the indicator. I think we have resolved that the indicator in the bank should be airspeed with a fixed stick so that the offset gimbal does not confuse the stick pressure. I am satisfied that this is correct, and that that will show whether a gyro will be G-Load stable and unable to buntover. Whether we need to change the terminology somehow doesn't matter to me. That we can identify the condition Chuck says can lead to a buntover, is important to me. Your thoughts?
- Greg
PS: The sad thing about all this, is it is all probably just academic. We all know, that if you install an adequate pitch dampener (HS), the pitch rates probably would not be so bad that buntovers in even a statically unstable gyro might be stopped by the pilot. And, the reverse is true too - if an adequate HS is employed to achieve good strong static pitch stability, it is probably dynamically dampened enough to avoid PIO too!
Last edited:
Al_Hammer
Platinum Member
- Joined
- Oct 30, 2003
- Messages
- 1,347
- Location
- Deep River, CT
- Aircraft
- none currently
- Total Flight Time
- 80 gyro; 65 helicopter(R22)
Greg, in response to your number :
1) The CLT configuration with RTV behind the cg and download on the stab does have a strong negative slope to the pitching moment line and therefore it is more pitch stable than a CLT with no loading.
This does not say anything about its response to having the stab in the propwash, or any other interactions.
It merely shows that you'll be AOA stable when trimmed up at a given airspeed.
2.) You said "My conculsion from this, for several reasons in this paragraph, is that the bottom two examples of HTL are not adequate design of the HS - unless it's not really HTL! "
The best pitch response of the HTL gyro comes from having a sufficiently loaded stab to force the RTV to be in front of the cg.
The other designs are less positively stable, all else being equal, although they are still stable.
3.) "In the LTL column: Again, this seems to show the less up-loaded HS provides the stronger total pitch moment. Unless I'm really missing something, this seems to support my argument that the downloaded HS is more pitch stable! Where am I going wrong? "
The 3 configs are equal in pitch stiffness: LTL with no download , HTL with large download, or CLT with download and RTV behind the cg.
Actually, the diagrams are arranged such that the top row has the best pitch stiffness.
Note that all these configs have the RTV behind the cg
The next row has medium pitch stiffness, with RTV always on the cg
and the weakest pitch response is when the gyro has RTV ahead of the cg, even if it can be made stable.
=========================
Udi,
I might be able to work up some numbers at some point, but I used good old fashioned graphical analysis. I'll, of course, be interested to see your spreadsheet figures and hope that they don't make a liar out of me.!
I know that the rotor lift slope is less than the slope of the stab(reasons given in other threads) and it will slope down or up depending on whether RTV is behind, or ahead of the cg , but I didn't try to portray an exact value, but I did try to be consistent in how I drew the lines from diagram to diagram.
The stab has a steeper slope(green line) and it always slopes down with increasing AOA.
If you add two lines, which is what we're doing graphically, the slopes will add. Two lines sloping the same direction will have a resultant line with twice the slope. If the lines are sloping in opposite directions, the slopes tends to cancel.
A line plus a horizontal line is sloping at the same angle, but shifted up or down as in thre ones where I showed prop thrust as a constant moment that doesn't change with AOA.
Using this basic reasoning it is pretty easy plot the curves. The results are only approximate, but they should give an accurate indication of the trend.
======================
Re; G-load stability. I always tend to think in terms of AOA stability so I don't confuse myself.
If a gust ,(or anything)increases the g-load, it must raise the AOA of the rotor. Even if the the rotor thust is on the cg and there is no moment, the stab will pitch up from the same gust and so the AOA stability (negative sope to pitch moment) provides g load stability I think.
Some other terms still confuse me. Raghu insists that the front wing be more heavily loaded than the rear lifting surface and I do not understand that rule other than to recall that it is essential in a FW design to have the front wing stall first.
The next step would be to create a little javascript program that would run on a webpage that would generate the graphs on the fly. You'd just select the config you wanted from a pull down menu, or maybe type in some parameters and it would plot the lines and run the numbers. No big deal to do. I thought it would be better to start with static diagrams before getting too fancy with the graphics.
It would be nice to look at dynamic response by having some animation too. Chuck emphasized the fact that the spring constant of pitch stiffness helps static stability, but adds to dynamic instability becaue of overshoot.
Dynamic response could be animated but things tend to get out out of hand quickly if you try to cram too musch clever stuff into a web page script.
You guys that want to work with spreadsheets are nuts. I hate those things and am more comfortable with my other tools.
1) The CLT configuration with RTV behind the cg and download on the stab does have a strong negative slope to the pitching moment line and therefore it is more pitch stable than a CLT with no loading.
This does not say anything about its response to having the stab in the propwash, or any other interactions.
It merely shows that you'll be AOA stable when trimmed up at a given airspeed.
2.) You said "My conculsion from this, for several reasons in this paragraph, is that the bottom two examples of HTL are not adequate design of the HS - unless it's not really HTL! "
The best pitch response of the HTL gyro comes from having a sufficiently loaded stab to force the RTV to be in front of the cg.
The other designs are less positively stable, all else being equal, although they are still stable.
3.) "In the LTL column: Again, this seems to show the less up-loaded HS provides the stronger total pitch moment. Unless I'm really missing something, this seems to support my argument that the downloaded HS is more pitch stable! Where am I going wrong? "
The 3 configs are equal in pitch stiffness: LTL with no download , HTL with large download, or CLT with download and RTV behind the cg.
Actually, the diagrams are arranged such that the top row has the best pitch stiffness.
Note that all these configs have the RTV behind the cg
The next row has medium pitch stiffness, with RTV always on the cg
and the weakest pitch response is when the gyro has RTV ahead of the cg, even if it can be made stable.
=========================
That's certainly true.Al, another clear (to me) conclusion that I think can be drawn from your diagrams is that the more stable pitch moment - steeper negative slope - is when the CG is forward of the RTV.
Udi,
I might be able to work up some numbers at some point, but I used good old fashioned graphical analysis. I'll, of course, be interested to see your spreadsheet figures and hope that they don't make a liar out of me.!
I know that the rotor lift slope is less than the slope of the stab(reasons given in other threads) and it will slope down or up depending on whether RTV is behind, or ahead of the cg , but I didn't try to portray an exact value, but I did try to be consistent in how I drew the lines from diagram to diagram.
The stab has a steeper slope(green line) and it always slopes down with increasing AOA.
If you add two lines, which is what we're doing graphically, the slopes will add. Two lines sloping the same direction will have a resultant line with twice the slope. If the lines are sloping in opposite directions, the slopes tends to cancel.
A line plus a horizontal line is sloping at the same angle, but shifted up or down as in thre ones where I showed prop thrust as a constant moment that doesn't change with AOA.
Using this basic reasoning it is pretty easy plot the curves. The results are only approximate, but they should give an accurate indication of the trend.
======================
Re; G-load stability. I always tend to think in terms of AOA stability so I don't confuse myself.
If a gust ,(or anything)increases the g-load, it must raise the AOA of the rotor. Even if the the rotor thust is on the cg and there is no moment, the stab will pitch up from the same gust and so the AOA stability (negative sope to pitch moment) provides g load stability I think.
Some other terms still confuse me. Raghu insists that the front wing be more heavily loaded than the rear lifting surface and I do not understand that rule other than to recall that it is essential in a FW design to have the front wing stall first.
Thanks again for the diagrams. Now you wouldn't want to expand your matrix of diagrams to add in the effects of airframe drag/lift moments, would you? I don't think the real story is over until ALL the moments on the aircraft are considered!
The next step would be to create a little javascript program that would run on a webpage that would generate the graphs on the fly. You'd just select the config you wanted from a pull down menu, or maybe type in some parameters and it would plot the lines and run the numbers. No big deal to do. I thought it would be better to start with static diagrams before getting too fancy with the graphics.
It would be nice to look at dynamic response by having some animation too. Chuck emphasized the fact that the spring constant of pitch stiffness helps static stability, but adds to dynamic instability becaue of overshoot.
Dynamic response could be animated but things tend to get out out of hand quickly if you try to cram too musch clever stuff into a web page script.
You guys that want to work with spreadsheets are nuts. I hate those things and am more comfortable with my other tools.
Last edited:
StanFoster
Active Member
- Joined
- Nov 16, 2003
- Messages
- 17,139
- Location
- Paxton, Il
- Aircraft
- Helicycle N360SF
- Total Flight Time
- 1250
I have to add this intellectual tidbit to this fine discussion....
I feel so stupid.......:hail:
You guys are in a class all by yourselves....
Stan
I feel so stupid.......:hail:
You guys are in a class all by yourselves....
Stan
Al_Hammer
Platinum Member
- Joined
- Oct 30, 2003
- Messages
- 1,347
- Location
- Deep River, CT
- Aircraft
- none currently
- Total Flight Time
- 80 gyro; 65 helicopter(R22)
Stan, you are a refreshing addition to this discussion. Unfortunately I am not at home and so cannot whip out my grinning skeleton for you.
Similar threads
- Replies
- 2
- Views
- 642
- Replies
- 42
- Views
- 11K