Horsepower and torque have a well defined relationship Greg....
It appears to me that your chart is journalistic fantasy that often arises when the published numbers can’t be achieved.
Vance
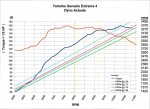
Only a putz would ignore the obvious. First, the graph uses HP as the scale. MS Excel is limited and won't allow adding a second Torque scale so I used ~1/2 HP as a general indicator to illustrate the torque curve as a relationship to HP - certainly NOT to provide absolutes in terms of torque numbers.
Second, a professional will recognize at once that there are acceptable limits to accuracy in any measurement, as well as limits in interpreting the graphing of that data. The accuracy of any data given is nonsense unless it comes with a suitable range of error. If none is provided specifically, then it is to be interpreted as +/- the increments shown. HP numbers according to the graph are therefore only accurate to within +/- the increment between the numbers indicated: +/- 5 HP. If I wrote the graph in 1 HP increments, you could then interpret the data to within +/- 1 HP.
Torque can be approximated to within 1/2 that, or+/- 2.5 pounds per foot.
Class, may I have your attention please? You there, in the back, stop passing notes to Suzie. You two can canoodle after the bell if you like.
Let's look at the data given for 8000 ERPM. The HP indicated is closest to the 125 line, and within the margin of error is therefore to be interpreted as anywhere between 120-130 HP.
Torque looks to be closest to 145 on the HP scale, and is therefore
1/2 x (140 > 150), or T = 70 > 75
ERPM is +/- 500 ERPM, therefore 7500 > 8500
So what does this all mean? Well, the HP you can accurately extrapolate from the data provided is anywhere from 70 to 75 PF @ 7500 to 8500 ERPM, which is therefore in the range of 100 HP > 121.4 HP.
Vance, from his front-row seat: "AHA!"
Not so fast, Mr. Breeze.
You see, (third, and finally) the data was taken at well over 1500MSL, in Vermont. Forgetting about humidity and temperature (It was done indoors, so if you really want to do this at home, you can assume 72F and 35% humidity), we adjust for altitude: about 3% per thousand feet if memory serves...
That means you have to add back 4.5% to the data, and now the adjusted HP under ideal atmospheric conditions (the only scale anyone can ever use universally) we now see that the accepted, adjusted, range is 104.5 HP > 126.8 HP.
The numbers are certainly, inarguably, well within the stated claims.
How many times do we have to go through this, Vance, before you accept the fact that this motor makes 140-150 HP? I gave you one of these sheets in hard copy, printed on card stock for durability, at Mentone 2012. I have discussed the graph and the YG4 power many times previously, here and elsewhere. This graph is absolutely bona fide and accurate as published - whether you want to acknowledge the fact or not. However, understand I do not require your endorsement.
I had the YG4 climbing at 8700 RPMs using 2.58:1 gears at Bensen Days 2013, and you, yourself, said here on RF candidly, afterward, that it appeared to you that I was running at about 130-135 HP at the time. Now you're trying somehow re-interpret the data you had in your hands at that time, and your own personal observations, to try to cut me down yet again for the umpteenth time for your own amusement? What, exactly is your agenda, and what are you trying so hard to shoot down and prove? You can't have it both ways. Apparently you didn't like it when it came out after Bensen Days that I was only running 8700 RPMS when you witnessed my gyrocopter in flight. I guess you thought I was running WOT at 10,700 RPMs? ROTFLU, boy. It NEVER ran more than 9000 on ANY day, for 130 hours, until just this year when I re-geared the PSRU to 2.72:1 and now run up to 9400 ERPM at 10 - 3000' MSL summer days.
Whatever. I'm out.
See you folks at Mentone. Look me up there, and check out the new Mohawk Silent Drive GTP.